| Eyeballing the line of best fit | |
|---|---|
 | |
| Description | |
| Exercise Name: | Eyeballing the line of best fit |
| Math Missions: | 8th grade (U.S.) Math Mission, High school statistics and probability Math Mission |
| Types of Problems: | 1 |
The Eyeballing the line of best fit exercise appears under the 8th grade (U.S.) Math Mission and High school statistics and probability Math Mission. This exercise visualizes linear trends in scatter plots.
Types of Problems[]
There is one type of problem in this exercise:
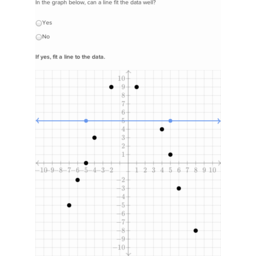
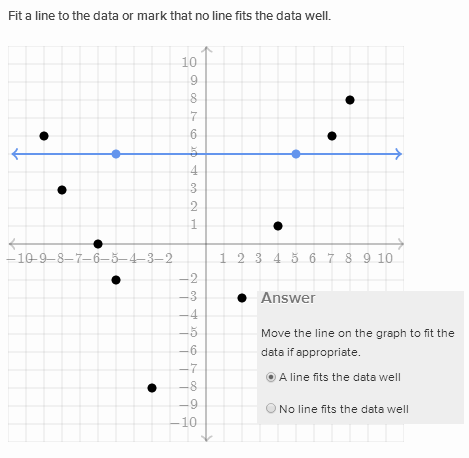
- Find the line of best fit: This problem displays a scatter plot with several data points. The user is to use the manipulative to sketch the line of best fit, or otherwise indicate that there is no line that fits the data well.

Find the line of best fit
Strategies[]
This exercise is hard to get accuracy badges because the manipulative feels like it is a little touchy, being off by a little can cause the answer to be incorrect. The speed badges are easy if user can find a way to ensure that they get the answer correct because it is fast to move points in the manipulative.
- Regression measures the line of best fit, not association. If there is a pattern but it is not a line, user must click that there is no line that fits the data.
- It seems it is easier to get the answer as correct if user pulls the points of the line far to the left and right. This allows fine movement of the line up and down.
Real-life Applications[]
- As an element of design, lines can stand alone or be part of another graphic element. They are one of the building blocks of graphic design.
- Data and statistics appear in news reports and in the media every day.
- Many of the problems in this exercise could be viewed as real-life applications.
- Statistics can be seen more frequently than calculus in every day life.