| Reading box plots | |
|---|---|
 | |
| Description | |
| Exercise Name: | Reading box plots |
| Math Missions: | 6th grade (U.S.) Math Mission, High school statistics and probability Math Mission |
| Types of Problems: | 1 |
The Reading box plots exercise appears under the 6th grade (U.S.) Math Mission and High school statistics and probability Math Mission. This exercise increases experience with reading summary statistical information from a boxplot.
Types of Problems[]
There is one type of problem in this exercise:
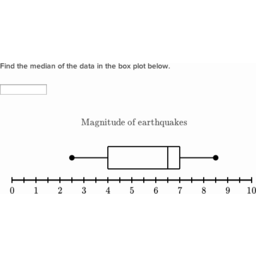
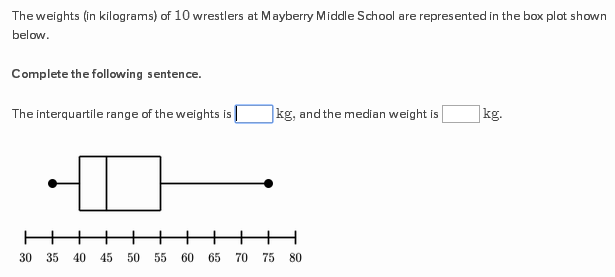
- Find the requested information from the boxplot: This problem provides a boxplot with a labeled axis and asks two pieces of information about the boxplot. The student is expected to enter the answers to the questions in the available space.

Find the requested information from the boxplot
Strategies[]
Being able to create a boxplot is an advantage on this exercise because it helps to understand the structure of the plot to answer questions.
- The boxplot is created by using a dot, three lines, and another dot to mark the minimum value, the first quartile, the median, the third quartile, and the maximum.
- The questions asked are a measure of spread and the median. The measure of spread can be the IQR or the range.
- The median is always the second blank, the measure of spread is the first.
- IQR is found by Q3-Q1 and the range is found by subtracting Max-Min.
Real-life Applications[]
Data and statistics can be found in everyday media to display information to consumers. Furthermore, analyzing data and statistics is a growing field.