The Creating box plots exercise appears under the 6th grade (U.S.) Math Mission and High school statistics and probability Math Mission. This exercise teaches how to create box-whisker plots (also called boxplots in some contexts).
Types of Problems[]
There is one type of problem in this exercise:
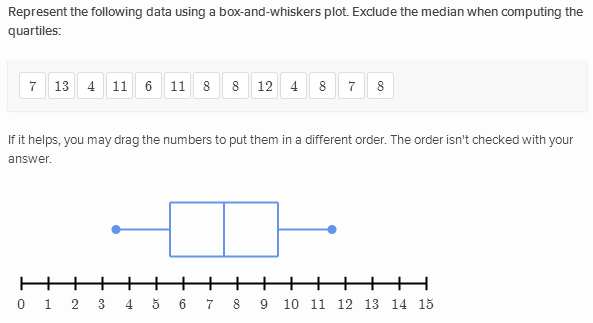
- Make the box-whisker plot: This problem provides a list of several numbers. The user is asked to create a box-whisker plot from the available data using the manipulative.

Make the box-whisker plot
Strategies[]
This exercise is easy to get accuracy badges as long as the user knows how to calculate the five-number summary. It is medium to get speed badges especially if user uses the manipulative to put the numbers in numerical order.
- The five-number summary consists of the Minimum, the First Quartile, the Median, the Third Quartile, and the Maximum.
- The First Quartile is the median of the lowest half of numbers and the Third Quartile is the median of the upper-half of data values.
- Khan Academy accepts the calculation of quartiles where the user removes the median when there are an odd number of data points.
- The user does not need to put the numbers in order to get the right answer, it is not part of the solution, only the plot.
- The TI-83/84 level calculator can be used by quickly writing the data values into L1 and performing 1-VarStats on L1 (the five-number summary is found by scrolling downward).
Real-life Applications[]
- Data and statistics appear in news reports and in the media every day.
- Many of the problems in this exercise could be viewed as real-life applications.
- Statistics can be seen more frequently than calculus in every day life.