| Interpreting two-way tables | |
|---|---|
 | |
| Description | |
| Exercise Name: | Interpreting two-way tables |
| Math Missions: | 6th grade (U.S.) Math Mission, High school statistics and probability Math Mission |
| Types of Problems: | 3 |
The Interpreting two-way tables exercise appears under the 8th grade (U.S.) Math Mission and High school statistics and probability Math Mission. This exercise explores and analyzes bivariate data using contingency tables and analysis of percentages.
Types of Problems[]
There are three types of problems in this exercise:
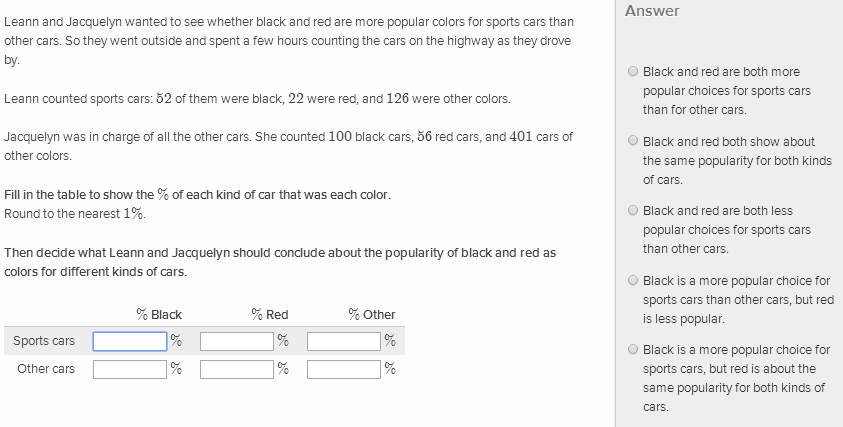
- Fill in chart and infer: This problem gives some raw data and a blank chart. The user is asked to fill in the chart with the correct percentages based on the numbers, and then answer a question about the data.

Fill in chart and infer
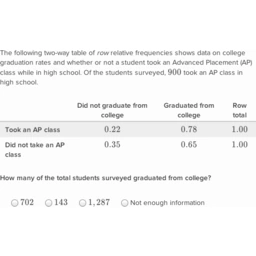
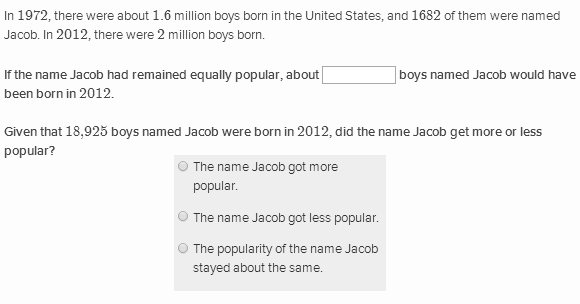
- Answer and infer: This problem describes a situation involving data. The user is asked to answer a particular question based on the information provided (words and/or charts) and then answer a summative question about the data.

Answer and infer
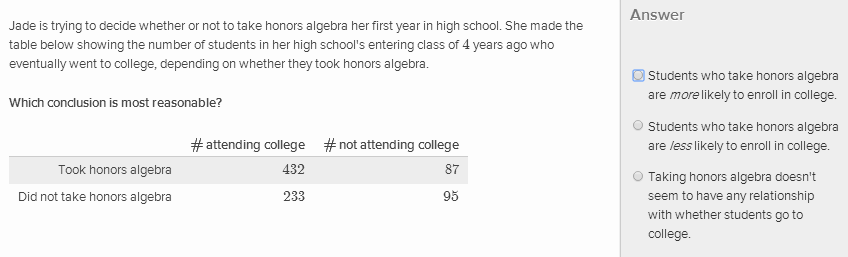
- Analyze the situation: This problem uses words and charts to describe a situation. The user is asked to answer a question about the information in the problem.


Analyze the situation
Strategies[]
This exercise is medium to get accuracy badges because user has to be very careful with calculations and inference. The speed badges are hard because it takes a fair amount of time to read, analyze and answer.
- Differences of 1% are certainly not significant, whereas 10% are. The middle ground is really based on the size of the samples.
- Research awarded the first speed badge very easily, but did not continue to see if it was a fluke. If it is not, the speed badges might have a reasonable tolerance and could be upgraded to medium.
Real-life Applications[]
- Data and statistics appear in news reports and in the media every day.
- The business world is relying on statistics more and more every day
- Many of the problems in this exercise could be viewed as real-life applications.
- Statistics can be seen more frequently than calculus in every day life.
- A boxplot is useful for dividing data into manageable quarters.