The Linear models of bivariate data exercise appears under the 8th grade (U.S.) Math Mission and High school statistics and probability Math Mission. This exercise plays with regression lines and their ability to predict trends.
Types of Problems[]
There are two types of problems in this exercise:
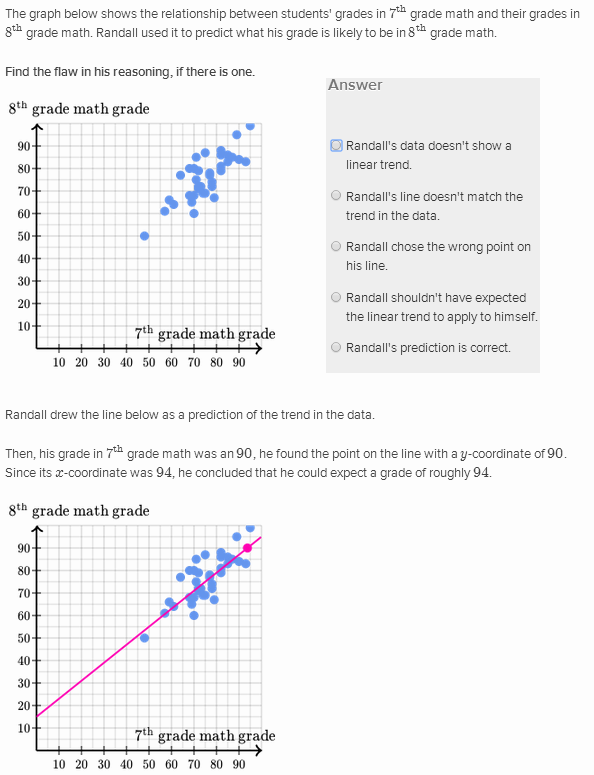
- Analyze reasoning: This problem describes a situation where a scatterplot and regressions line were found and used to make a prediction. The user is asked to analyze the situation and decide if a valid conclusion was drawn, or why an error was made.

Analyze reasoning
- Use line to predict: This problem displays a scatterplot and the users are asked to use the plot to answer a question assuming the relationship in the plot is linear and continues.

Use line to predict

Strategies[]
This exercise is medium to get accuracy badges. Research was getting them correct but because it is easy to imagine that the tolerances might be too tight when estimating lines. If the process has reasonable tolerance, than the speed badges should be easy because the same reasons recycle for the some questions.
- The answer for Analyze reasoning will either be: trend is not linear, line does not fit, wrong point was used, extrapolated too far, or prediction is correct.
- Estimation close to integers or nicely rounded numbers worked well on about ten problems in a row, so students might not need to be super precise in their estimates and predictions.
Real-life applications[]
- Lines have many applications in business and the sciences.
- Intercepts tend to be initial conditions, and slope is the marginal cost to create more items.
- Data and statistics appear in news reports and in the media every day.
- Statistics can be seen more frequently than calculus in every day life.